Google recently conducted a groundbreaking experiment by using its Street View car to capture new information and make the invisible visible—all through pollution sensors.
The Google Street View car, which ordinarily roams streets in cities and rural areas worldwide photographing panoramic views, mapped and measured air quality in Oakland, California. Over the course of a year, two Street View cars with air pollution sensing systems fixed atop their roofs drove six to eight hours a day sampling every street in one section of the city.
The study is one of the largest sets of urban air pollution data ever captured, with nearly 3 million measurements over 14,000 miles.
Google’s Oakland experiment—which was done in partnership with the Environmental Defense Fund and environmental intelligence startup Aclima—found variations of nitrogen oxide, nitrogen dioxide and black carbon, particulate matter that worsens air quality and is harmful to people. These particles come from burning fuel, and high exposure to them is linked with respiratory illnesses, heart attack, stroke, some forms of cancer and premature death.
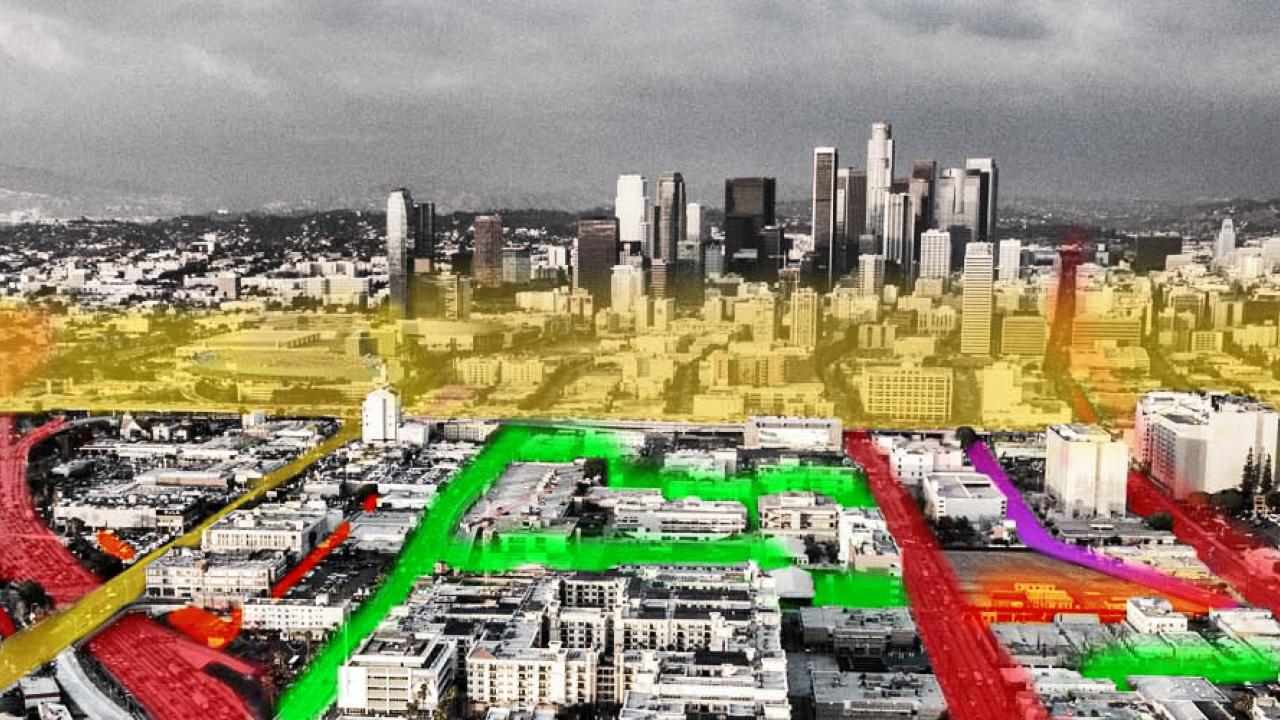
Interactive maps show why some areas are more polluted than others. For example, one neighborhood with high levels of pollution had heavy truck traffic and was located near a metal plant.
Most air pollution is measured at the city level, not the neighborhood or community level which is most relevant to people’s daily lives. Street-level air pollution data can help walkers, bikers and other commuters find the healthiest route for their trips. The validated data shows where and when air quality is good or bad.
Researchers from the University of Texas at Austin wrote about the study for the journal Environmental Science & Technology. The findings were made public to serve as a resource to explore air quality in the city and potentially improve it. Communities and policymakers can use the information to take action.
Aclima’s air pollution sensing systems could be added to other vehicles covering large distances in other locations to show pollution in fine details. The company has a prototype of a tinier, less expensive mobile platform that could fit in smaller cars and provide even more details.
Everyday data is used to guide decision-making. With the technology progressing, the experiment could be expanded to other urban and rural areas to provide air pollution data that could lead to smarter, more sustainable places and support efforts to reduce climate-changing greenhouse gases.